
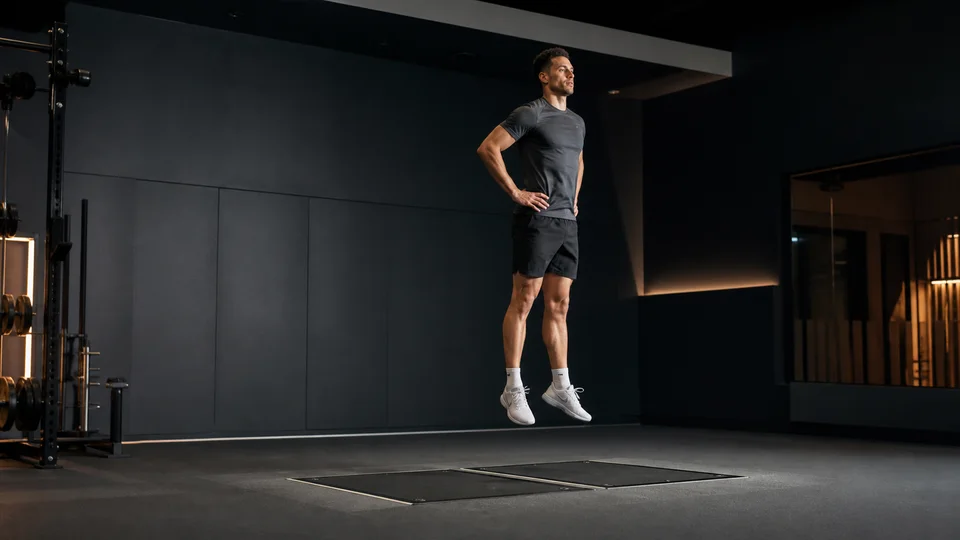
An athlete needs less than a second to jump. The software needs just a few moments to return dozens of numbers about this movement.
Height, takeoff speed, power, average force, peak force, impulse, contraction time, depth, rate of force development, asymmetry. The list grows with the equipment's capabilities — and the report may appear more sophisticated with each new column.
But there is a difference between have data and have information capable of guiding a decision.
If the coach cannot explain why a metric is on the dashboard, what change overcomes the measurement error and what would be done in the face of this change, the complexity has become decoration. At high throughput, the challenge is rarely to produce more numbers. It protects the signal from noise.
Technology produces resolution. The staff's job is to turn this resolution into clarity.
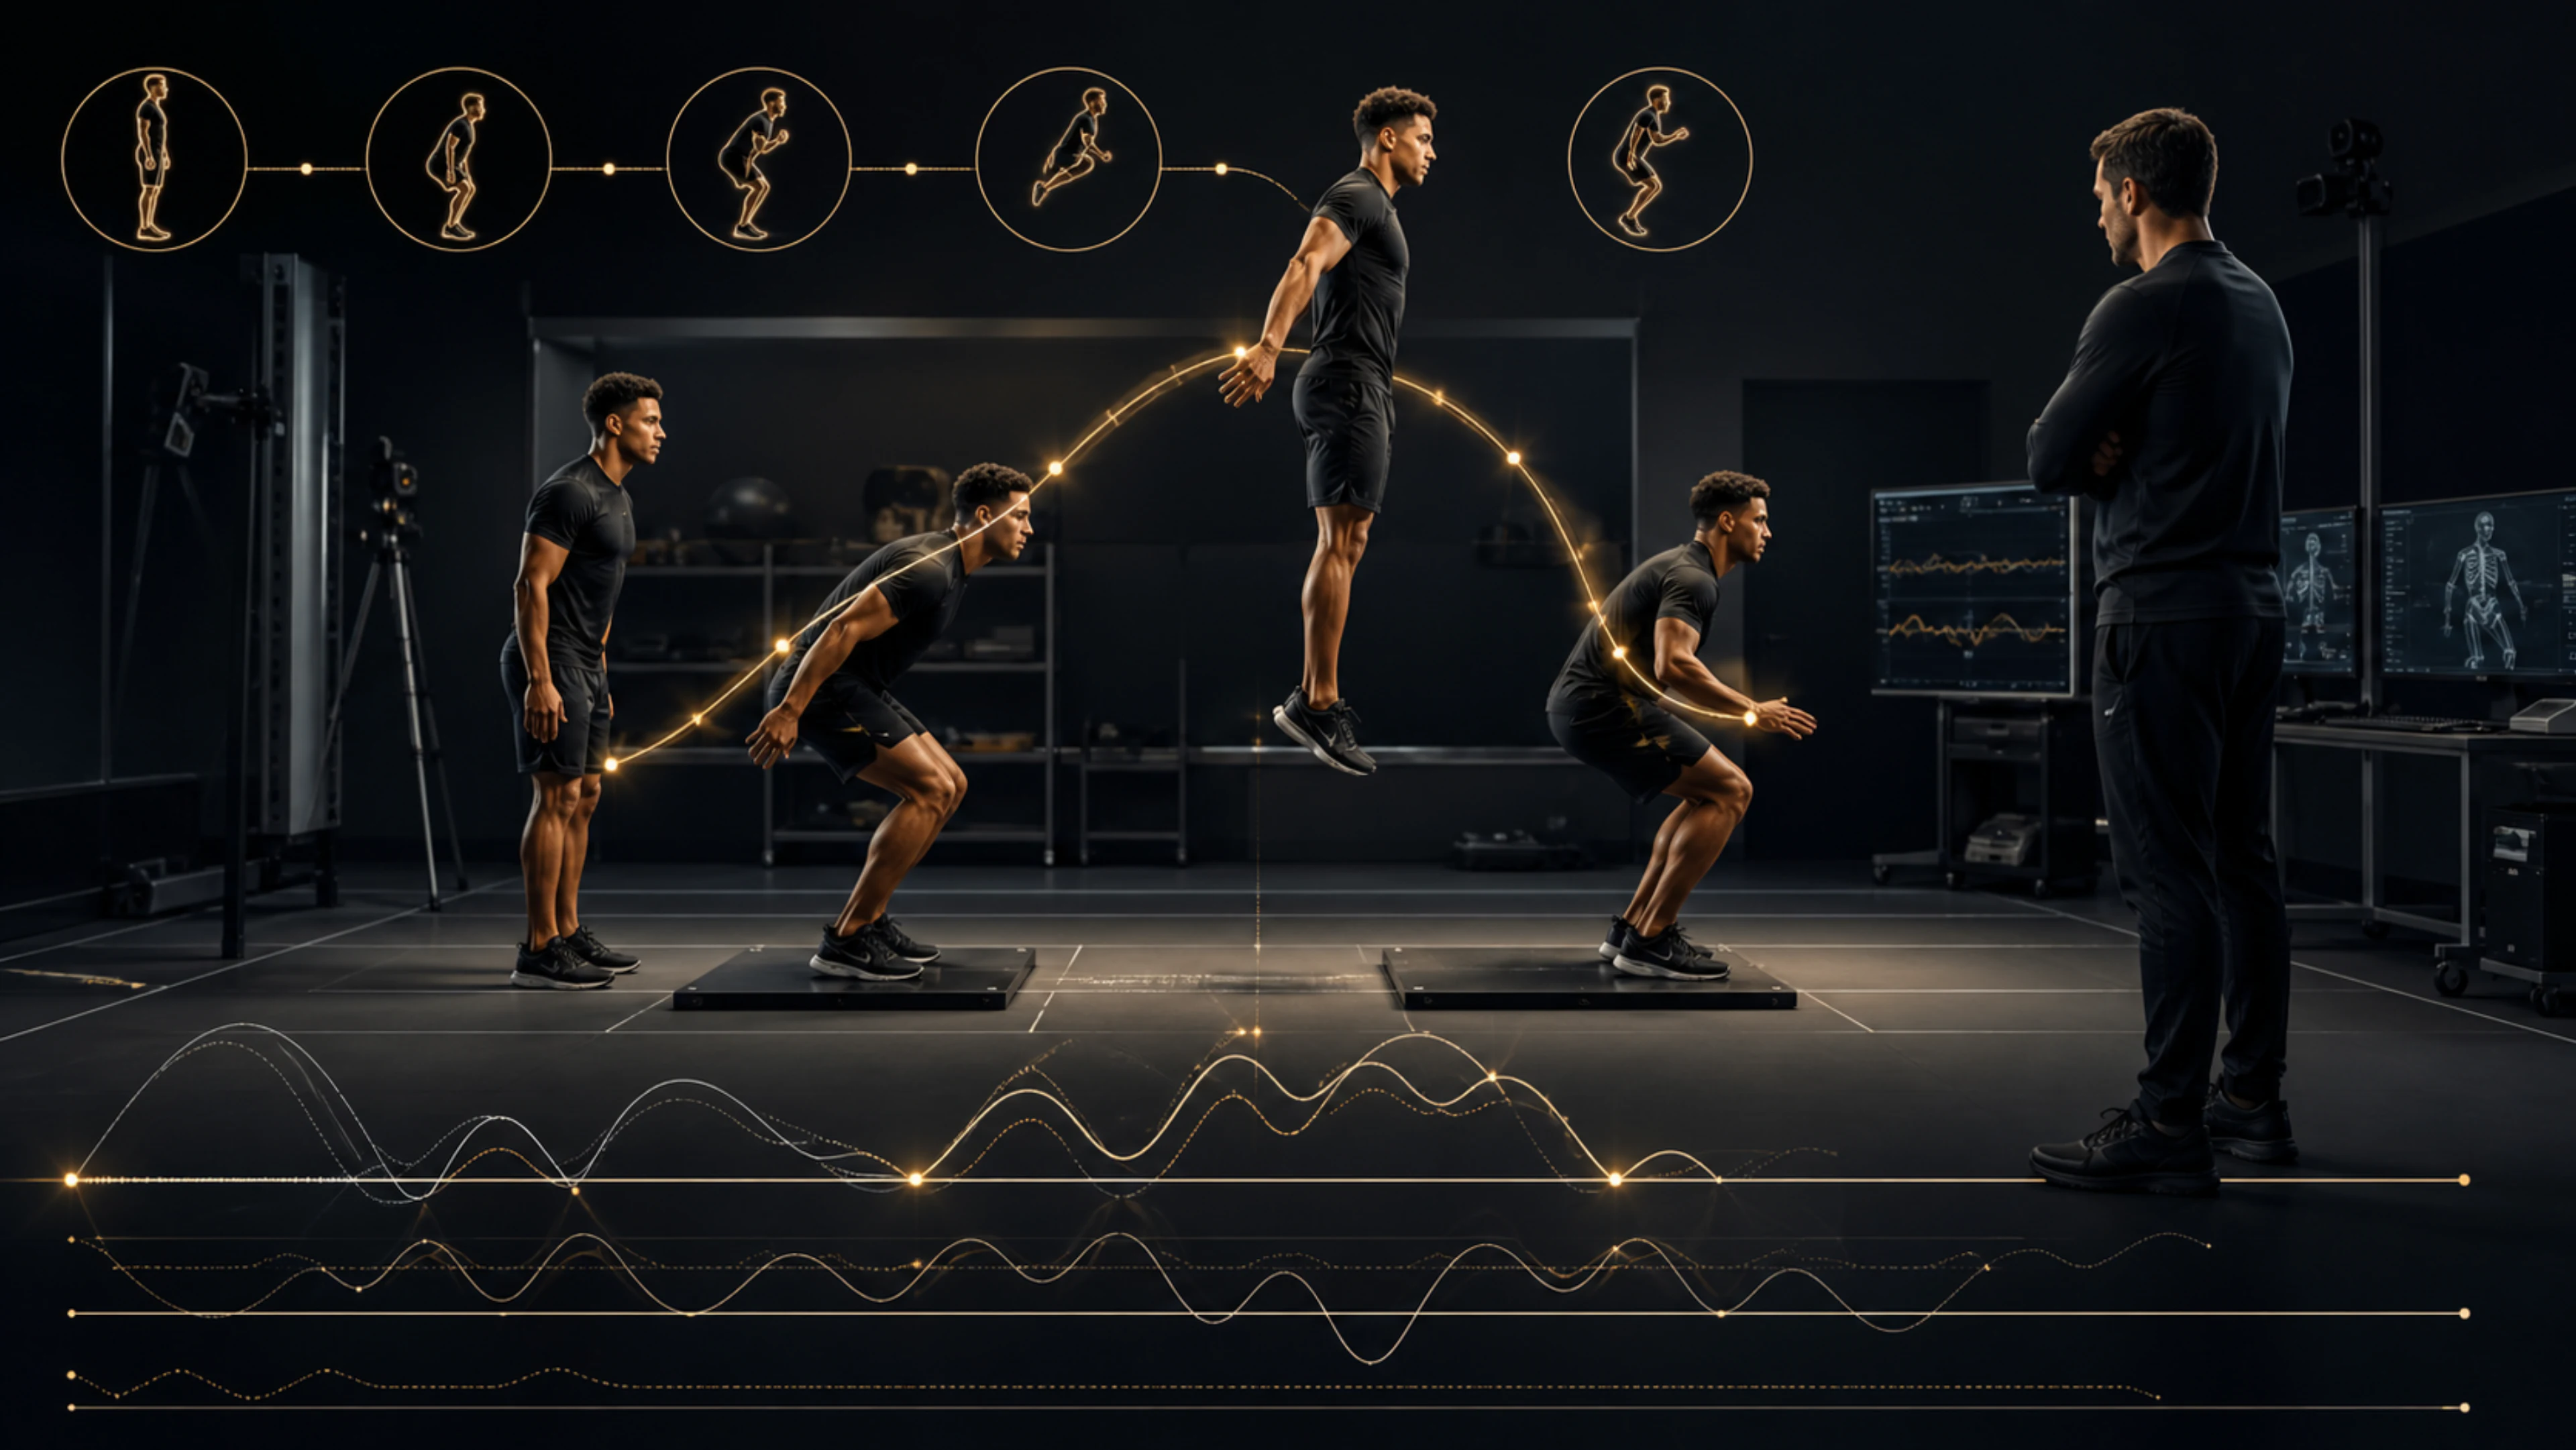
CMJ measures more than heel height
The countermovement jump — countermovement jump, or CMJ — is popular because it combines fast execution, low fatigue, and familiarity for many athletes. When performed on a force platform, the test records the relationship between force and time from the beginning of the descent until landing.
Different layers of information can be extracted from this signal: exit, such as height or takeoff speed; mechanical driver, such as strength, power and impulse; strategy, observed in the depth, duration and distribution between braking and propulsion; and distribution among members, when two platforms record each side separately.
This distinction matters because two jumps with the same height may have been constructed in different ways. An athlete can preserve output by taking longer to produce force, deepening the countermovement, or redistributing the contribution between the legs.
Looking only at height can hide this compensation. Looking at all available variables creates another problem: redundancy, instability and interpretations that contradict each other.
The first question is not “which metric?”, but “best for what?”
Given the amount of metrics produced by platforms, following a short panel can be more useful than allowing excess data to dilute attention.
The direction is good. The number alone doesn't solve it.
Three poorly chosen metrics continue to form a bad dashboard. Four variables that measure mathematically close versions of the same outcome create the illusion of confirmation without adding a new lens.
Before selecting any indicator, staff need to define the question: monitor readiness between sessions; monitor strength and power adaptation; understand the strategy used to jump; observe differences between limbs in rehabilitation; or compare profiles within a modality.
Each objective requires a different panel. The relevant metric for a longitudinal performance analysis may be too sensitive to noise for a daily decision. The useful variable in rehabilitation may have no role in a ten-minute collective monitoring.
Forty-five variables did not provide forty-five reliable information
A study published by Anicic and collaborators in 2023 helps to size up the problem. Seventy-nine physically active adults performed three CMJs in two sessions separated by 24 to 48 hours. The researchers calculated 45 metrics derived from the force–time curve.
Only 24 presented reliability considered acceptable according to the adopted criterion of coefficient of variation equal to or less than 10%. When these 24 variables were subjected to a principal components analysis, four components explained 91.8% of the total variance: overall performance; eccentric component; concentric component; and jump strategy.
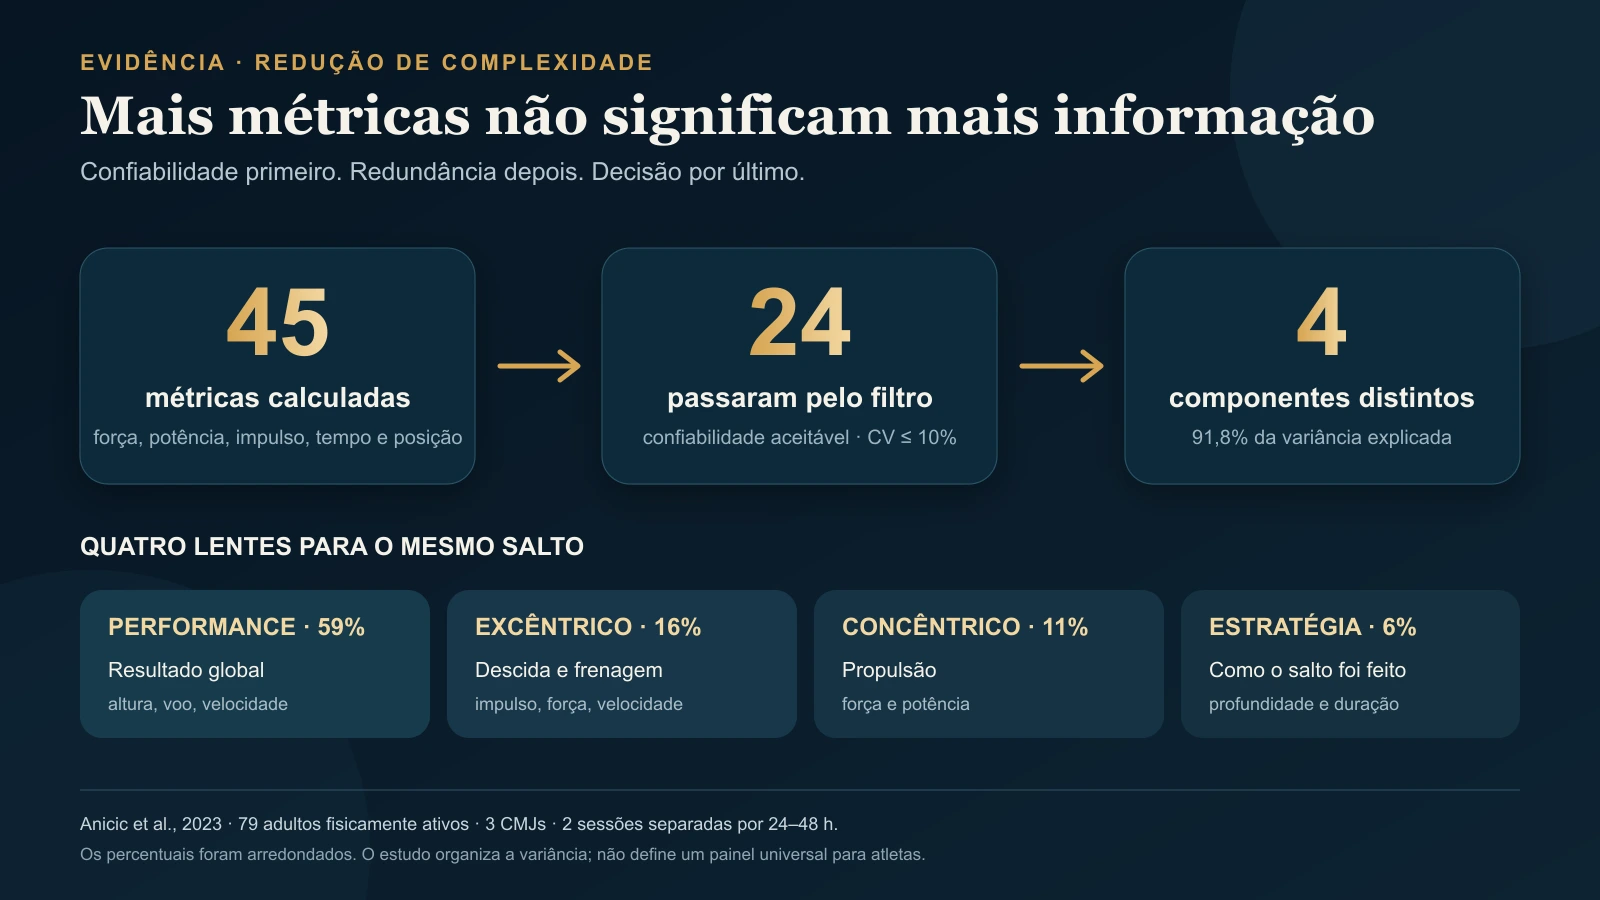
The finding does not mean that four universal metrics have been discovered. The analysis shows something more useful: many variables share information, and not all of them repeat themselves with enough stability for monitoring.
The rate of force development metrics — RFD — illustrate this caution. In this study, none met the interday reliability criterion; the coefficients of variation were at least 22.2%. In another investigation, with 112 university and club athletes, RFD measures also appeared among the least reliable variables.
This does not make RFD physiologically irrelevant. It makes its routine use more demanding. The smaller and noisier the analyzed window, the greater the protocol control needs to be before transforming an oscillation into a decision.
How the ideas connect
Simplifying is not just looking at height again
The opposite error would be to discard the entire force–time curve and reduce the CMJ to a single number.
In 2015, Gathercole and collaborators evaluated 22 variables before and after a fatiguing protocol in 11 university team sports athletes. The conclusion was that the traditional approach could miss relevant changes and that variables related to the neuromuscular strategy added information. The sample was small, but the study illustrates why the end result doesn't always tell the whole story of the movement.
A meta-analysis by Claudino and colleagues brought together 151 articles and 531 effect sizes. Average jump height was more sensitive to detecting fatigue and overcompensation than just choosing the best attempt. This is a seemingly simple processing decision, but it changes the test's ability to find signal.
In professional rugby players followed during the season, Howarth and collaborators analyzed 74 variables. Using the average of three jumps produced more indicators with signal greater than noise than selecting the tallest trial. The authors themselves highlighted that sensitivity depends on the population and the environment.
Reducing the panel does not mean impoverishing the test. It means preserving different functions and eliminating disguised repetitions.
A minimum viable dashboard to get started
There is no validated combination for all teams, modalities and decisions. Still, a home dashboard can be organized into three layers, with an optional fourth variable.
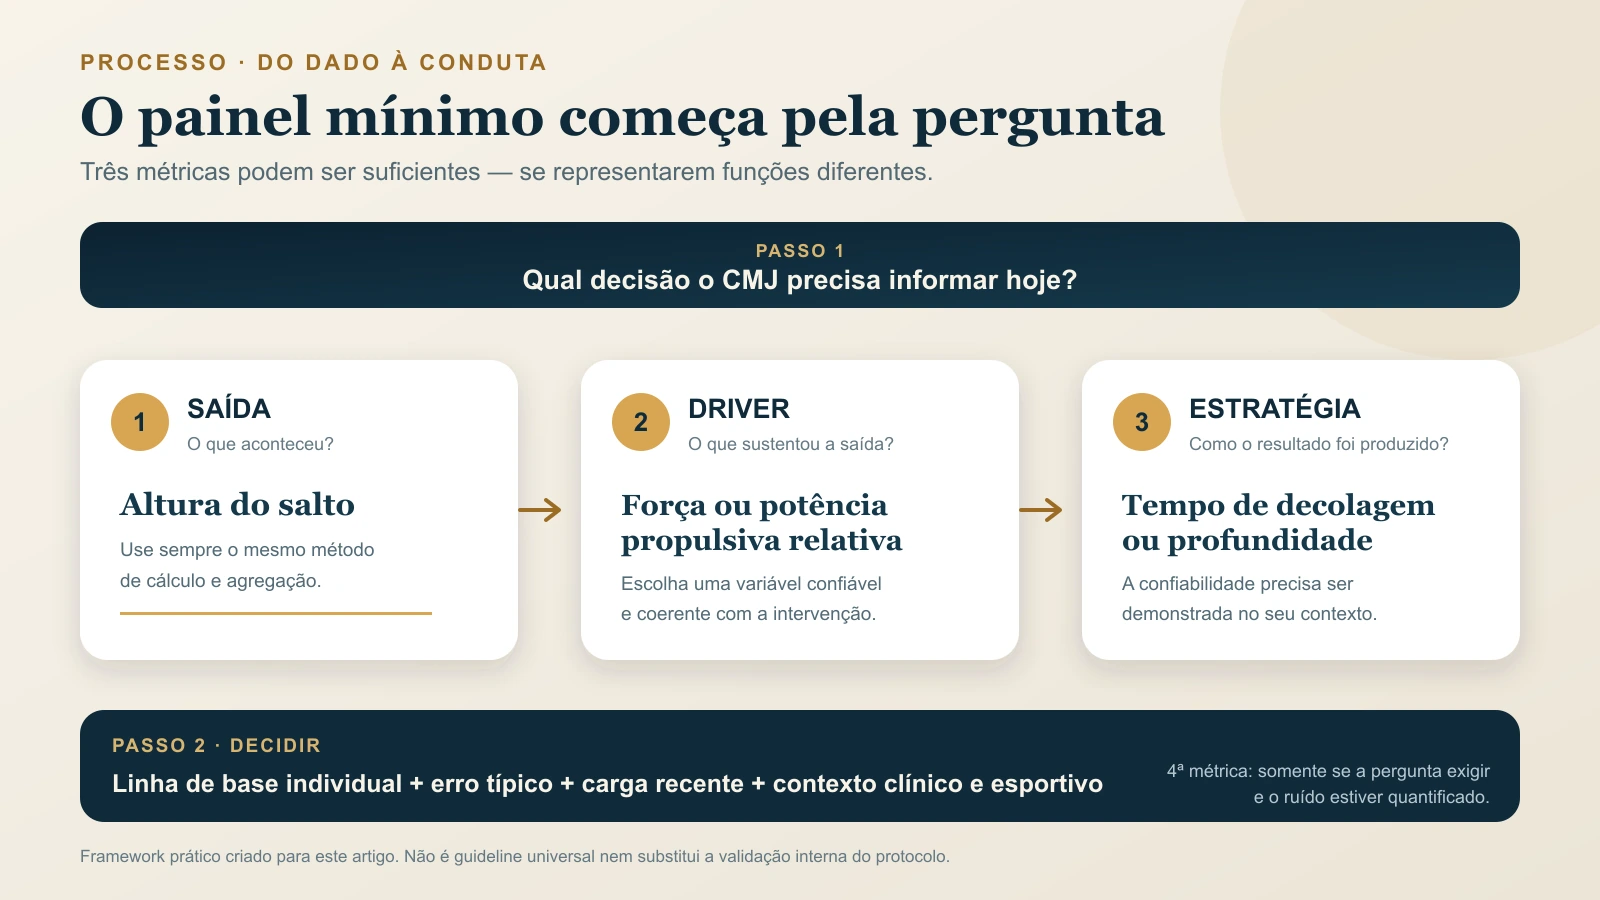
1. An output metric
Jump height remains intuitive, relevant, and generally reliable. The calculation method must remain consistent. Height derived from flight time and height calculated through the impulse–momentum method should not be used interchangeably as if they were equivalent.
It also makes no sense to count impulse–momentum height and takeoff speed as two independent pieces of evidence: one mathematically derives from the other.
2. A mechanical driver
Force or propulsive power relative to body mass can help understand what sustained the output. The choice must reflect the intervention. If the goal of the block is to increase the ability to produce force, a reliable force variable may be more useful than adding three composite indices.
Propulsive impulse may also be relevant, but its mechanical proximity to takeoff speed requires care not to duplicate information.
3. A strategy metric
Time until takeoff or depth of the countermovement helps to observe how the athlete achieved the result. The same height produced over time may have a different meaning when the question involves readiness, efficiency or technical change.
This layer only enters the panel when it presents sufficient reliability in the local protocol. Some temporal and eccentric measurements are more unstable than output and propulsion variables.
4. An optional, context-driven variable
Asymmetry, braking impulse, or a composite index can be useful when the question calls for it. They don't have to permanently occupy the main panel.
In asymmetries, care must be even greater. A technical report on 13 college baseball players showed that the reliability of the asymmetry index can be much worse than the reliability of the strength variable used to calculate it. The magnitude and even the favored side can fluctuate. An isolated percentage should not automatically be converted into a risk of injury or an indication for intervention.
The protocol decides how much of the number is athlete and how much is noise
A short panel doesn't make up for an inconsistent test.
The movement needs to be repeated under sufficiently similar conditions: instruction, warm-up, arm position, free or controlled depth, shoes, interval between attempts, time relative to the session and number of jumps.
The use of arms is an example. In college basketball players, jumps with and without arm swings produced reliable sets of variables, but served different purposes. The gesture with arms can bring the test closer to sports performance; Hands on hips reduce a source of variation and can facilitate readiness monitoring. The important thing is not to change the protocol in the middle of the historical series.
Nor should systems and definitions be mixed without checking agreement. A 2024 study compared three commercial platforms and found procedure, unit, and calculation differences between systems. Some metrics agreed well; others, especially RFD, showed biases. An identical name on the dashboard does not guarantee that the algorithm is calculating the same thing.
A comparison published in August 2026 reinforces this caution: differences in CMJ height depended on the calculation method, and agreement between force plate, video, and sensor was not uniform. Twenty volleyball players were enrolled, but reliability analyses included only 10–11 measurement pairs. The finding supports keeping the same system and protocol; it does not provide a universal fatigue threshold.
Data from 300 male athletes from five university sports, published in 2025, reinforces that reliability varies depending on sport and metric. Some eccentric variables required more than three jumps to reach the defined criterion, while concentric thrust and stepped power were more stable at three attempts or less. The protocol needs to balance measurement quality and collection cost.
From concept to decision
CMJ testing: when measuring more gets in the way of a decision
- CMJ measures more than heel height
- Forty-five variables did not provide forty-five reliable information
- The protocol decides how much of the number is athlete and how much is noise
Four filters before placing a metric on the dashboard
A variable only deserves permanent space when it passes through four filters.
- Relevance.Does it answer the staff's operational question or is it just available in the software?
- Reliability.Was the error between trials and sessions quantified in the population, equipment and protocol used?
- Sensitivity.Is the change that happens in practice usually greater than the measurement noise?
- Action.Is there a previously discussed course of action when the change is real — adjust the session, deepen the assessment, talk to the athlete or observe the trend?
Without the last filter, the dashboard is a file. It is not a decision system.
The CMJ reports a conversation; does not complete the diagnosis
An isolated fall does not prove neuromuscular fatigue. A high asymmetry alone does not identify risk of injury. A jump above the baseline does not confirm readiness for all competitive demand.
The CMJ becomes more useful when change is interpreted against the uncertainty of the protocol, forms part of a consistent trend, and is considered alongside recent load, pain, perceived recovery, the schedule, technical observation, and the aim of the microcycle.
Exceeding one typical error alone does not establish real change with 95% confidence. For two comparable measurements with no systematic bias and independent, approximately normal errors of equal magnitude, the minimum detectable change at 95% is 1.96 × √2 × SEM, approximately 2.77 × SEM. The SEM must match the metric and aggregation rule used, such as the mean of the jumps. This threshold describes uncertainty; practical relevance and training decisions require context.
In the field and in science, the best monitoring is not the one that shows the most columns. This is what makes it clear:
- What changed.Which indicator moved away from the baseline?
- How uncertain the change is.Does it exceed a change threshold consistent with the protocol and the stated confidence level?
- Why does it matter?Does the context support a relevant hypothesis?
- Which decision becomes considered.Observe, talk, investigate or adjust?
Technology increases test resolution. Criterion transforms resolution into clarity.
Frequently asked questions
How many jumps should go into the CMJ test?
Three attempts are common and provide a viable starting point, but the number needed depends on the modality, metric, and desired reliability. For monitoring, using the average of attempts usually preserves more information than choosing just the best jump.
What are the three best CMJ metrics?
There is no universal trio. A splash panel can combine an output such as height; a driver, such as relative propulsive force or power; and a strategy, such as time to liftoff or depth. The final choice must answer the question and overcome local noise.
Is jump height enough to monitor fatigue?
It can be useful, especially when the protocol is standardized and the average number of attempts is compared to the baseline. However, the athlete can preserve height by changing strategy. A second or third reliable metric helps reveal this process.
Does CMJ asymmetry indicate risk of injury?
Not in isolation. The index depends on the variable, the formula, the protocol and the reliability of the asymmetry itself. It can guide investigation and follow-up, but does not support individual injury diagnosis or prediction alone.
Verified references
Reading noteThe recommendation to reduce the panel does not define a universal trio. Selection depends on the question, internal reliability, calculation method, equipment, and population. Asymmetry or RFD metrics require additional caution.